What is a Triple Top Pattern?
A Triple Top is a chart pattern that signals a possible change in an asset’s price trend from upward to downward. It forms when the price reaches a certain high level three times but fails to break through, indicating that the market might be losing its strength and could reverse downward.
How Does the Triple Top Look?
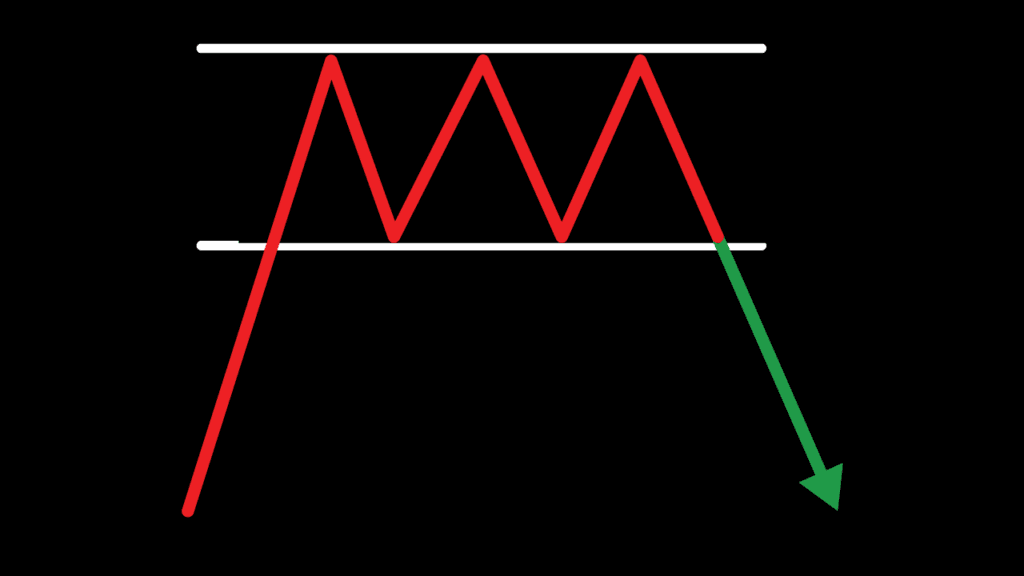
The Triple Top pattern looks like three peaks (or tops) that are roughly the same height. Here’s a step-by-step breakdown of how it forms:
- First Top: The price rises in an uptrend and reaches a high point (first top), but then pulls back as sellers step in.
- Second Top: After the pullback, the price rises again and reaches a similar high as the first top (second top), but once again, it fails to move higher and pulls back.
- Third Top: The price tries a third time to break through the previous high, but it fails again, creating the third and final top.
After the third top, if the price breaks below a key level known as the neckline (which is the support level connecting the lows between the tops), the Triple Top pattern is confirmed, and the price usually moves downward.

How Does the Triple Top Work?
The Triple Top pattern shows that buyers are having trouble pushing the price higher. Each time the price reaches the same high point (the tops), sellers take over, pushing the price back down. This shows that buying interest is weakening. Once the price breaks below the neckline, it confirms that sellers are in control, and the market is likely to move downward.
Here’s how the Triple Top works step by step:
- Uptrend Leading to the First Top: The price has been moving up for a while. Traders are buying, and the market looks strong. Then, the price hits resistance and forms the first top.
- Pullback and Second Top: After the first top, the price falls slightly but then recovers and tries to go higher again. However, the price hits the same level as before (second top) and pulls back once more.
- Third Top and Breakdown: The price attempts one last time to rise, reaching the same resistance level (third top) but fails again. After the third failure, if the price breaks below the neckline (support level), it’s a sign that the market could turn bearish.

Why Does the Triple Top Matter?
The Triple Top pattern is important because it helps traders spot when an uptrend might be ending. If the price breaks below the neckline, it signals that sellers are taking control, and the market could start moving downward. Traders can use this pattern to decide when to exit their long positions (if they were betting on the price going up) or to enter short positions (if they expect the price to fall).
How to Use the Triple Top Pattern?
Here’s a simple guide on how traders can use the Triple Top pattern:
- Identify the Three Peaks: Look for three distinct tops at roughly the same price level.
- Watch the Neckline: The lows between the tops form a horizontal line known as the neckline. This acts as a support level.
- Wait for Confirmation: Don’t act too quickly. Wait for the price to break below the neckline. Once it does, this confirms the pattern, and you can expect the price to move downward.
- Set Targets and Manage Risk: After the neckline breaks, traders often target a price drop that equals the distance between the tops and the neckline. To manage risk, they may set stop-loss orders above the tops to limit potential losses.

The Triple Top is a simple but effective chart pattern that signals a potential reversal from an uptrend to a downtrend. By spotting this pattern, traders can prepare for a market shift and make informed decisions.
If you want to learn more about chart patterns and technical analysis, visit Hunnier.com. Our site offers easy-to-understand guides and tips for anyone looking to improve their knowledge of cryptocurrency and trading.