Understanding Candlestick Patterns
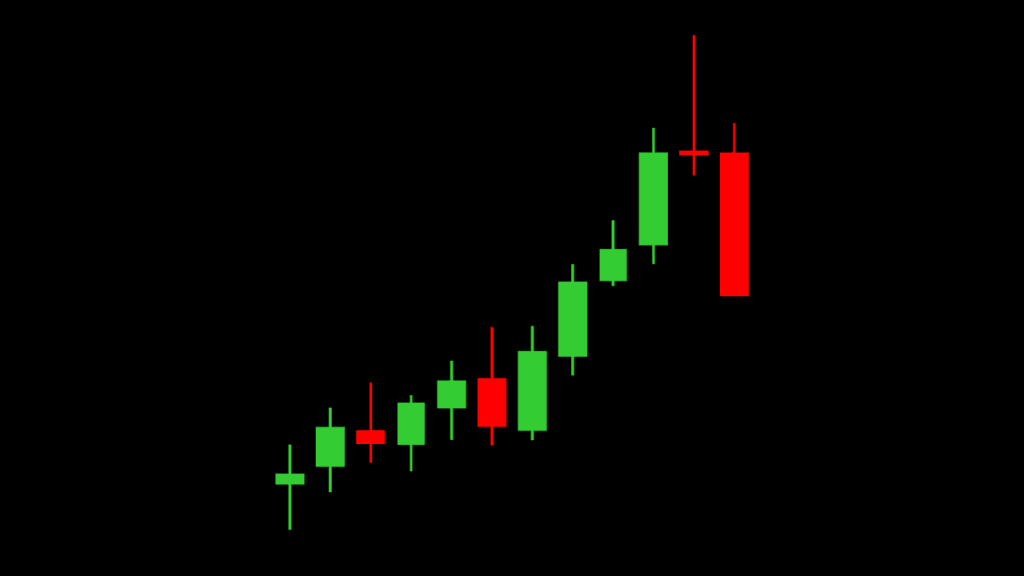
A candlestick is a tool used in trading to show the price movement of a financial asset, like stocks or cryptocurrencies, within a specific time period. Imagine it as a bar that tells a story of how the price of something changed over time. Each candlestick represents four key pieces of information:
- Open Price: The price at which the asset started trading at the beginning of the period.
- Close Price: The price at which the asset stopped trading at the end of the period.
- High Price: The highest price the asset reached during that period.
- Low Price: The lowest price the asset dropped to during that period.
These four elements help traders understand what happened to the price during a specific time, whether it’s one minute, one hour, one day, or even one week.
How to Read a Candlestick

Each candlestick has two main parts:
- The Body: This is the thick part of the candlestick, which shows the difference between the opening and closing prices. If the body is filled or colored (usually red or black), it means the price went down during that time. If the body is hollow or a different color (often green or white), it means the price went up.
- The Wick (or Shadow): These are the thin lines above and below the body. The top of the wick shows the highest price reached, and the bottom shows the lowest price. The wick gives you a full picture of how much the price moved during that period.
Why Are Candlesticks Important?
Candlesticks are crucial because they provide a visual representation of price movement, making it easier to spot trends and patterns. Traders use these patterns to predict what might happen next in the market. By recognizing certain formations, they can make more informed decisions on when to buy or sell.
Common Candlestick Patterns
Now, let’s dive into some of the most common candlestick patterns and what they mean.
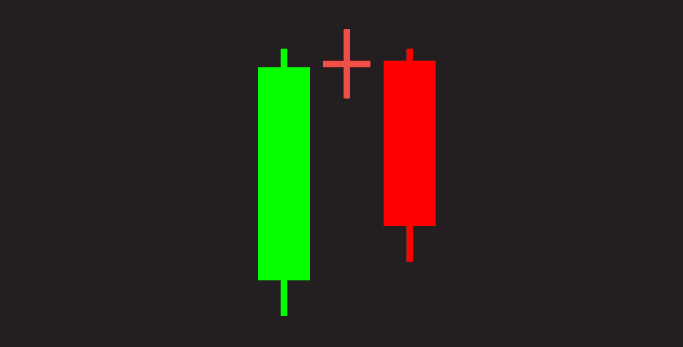
1. The Doji

A Doji looks like a plus sign, where the opening and closing prices are nearly the same. It indicates indecision in the market. The Doji can signal a potential reversal, meaning the current trend might be about to change direction.
- Example: If the price has been going up and you see a Doji, it could mean that the upward momentum is slowing down, and the price might start to fall.
2. The Hammer

The Hammer is a bullish reversal pattern, meaning it usually appears after a price decline and indicates that the price might start rising. It has a small body and a long lower wick, which shows that the price dropped significantly but then recovered before the close.
- Example: Imagine the price of a stock was falling, and suddenly a hammer appears. This could mean that buyers are stepping in, and the price might start going up.
3. The Shooting Star

This is the opposite of the Hammer and usually appears after a price rise. The Shooting Star has a small body and a long upper wick, showing that the price tried to go higher but was pushed down by sellers. It’s a bearish reversal pattern, suggesting the price might start to fall.
- Example: If a stock’s price has been rising and you see a Shooting Star, it might mean that the upward trend is losing strength, and the price could drop.
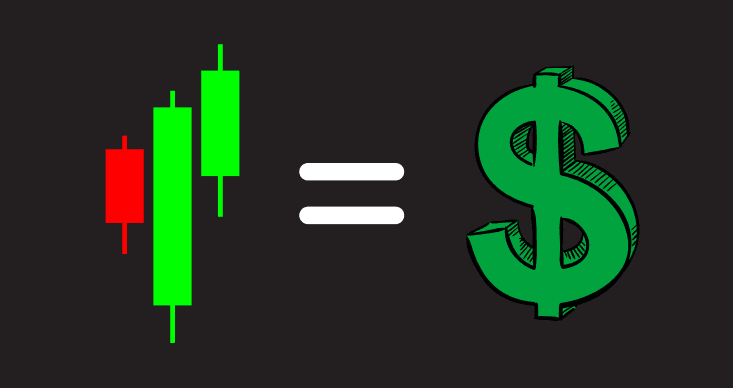
4. Bullish Engulfing
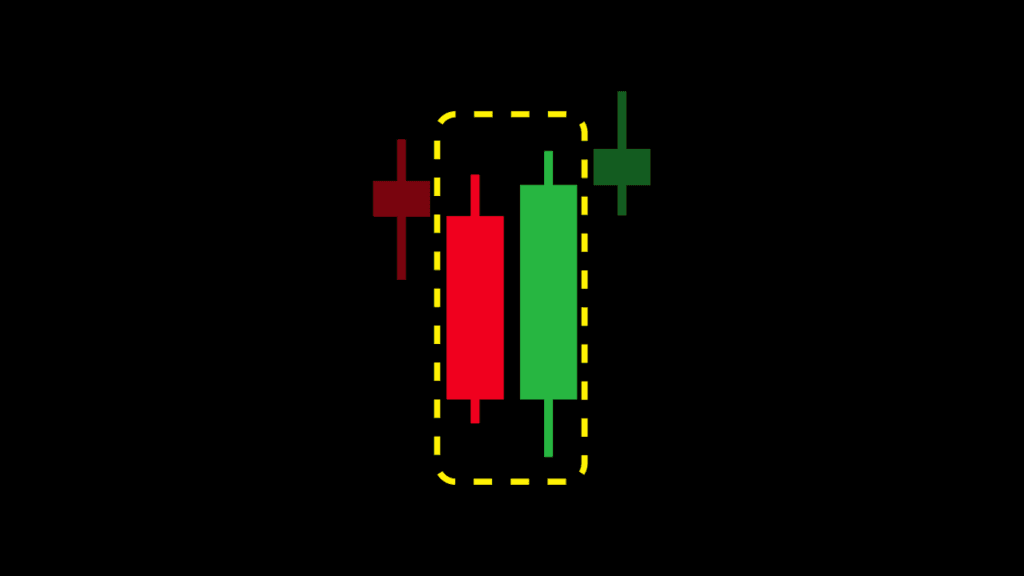
A Bullish Engulfing pattern occurs when a small bearish (downward) candlestick is followed by a larger bullish (upward) candlestick that completely “engulfs” the smaller one. This pattern often signals the start of an upward trend.
- Example: If you see a Bullish Engulfing pattern after a series of price drops, it might indicate that the buyers are taking control, and the price could start to rise.
5. Bearish Engulfing
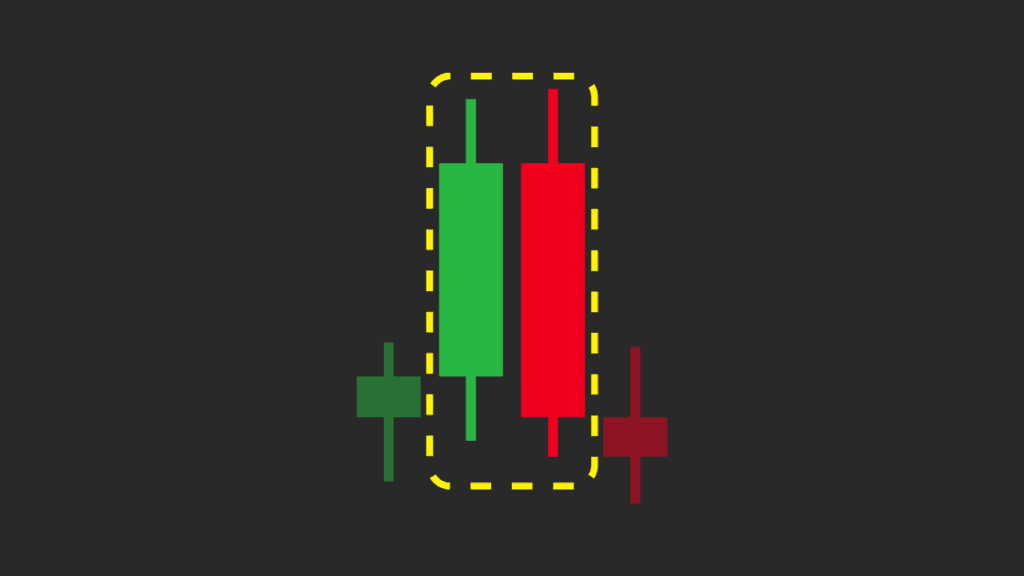
This is the opposite of the Bullish Engulfing pattern. It happens when a small bullish candlestick is followed by a larger bearish candlestick that engulfs the previous one. This pattern often suggests that the price might start to fall.
- Example: If a stock’s price has been rising and you see a Bearish Engulfing pattern, it might signal that sellers are gaining control, and the price could decrease.
6. The Morning Star
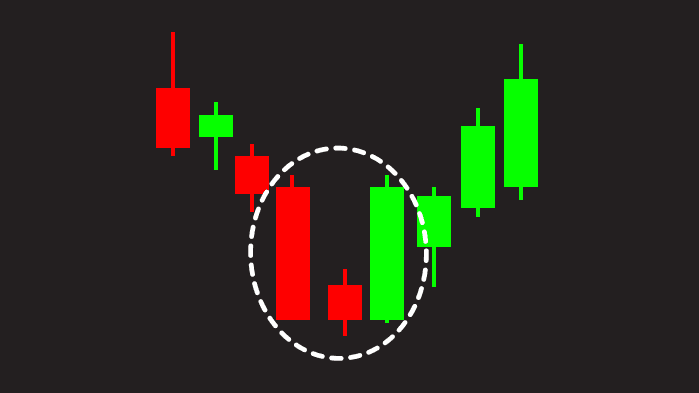
The Morning Star is a bullish reversal pattern, typically found at the end of a downtrend. It consists of three candles: a large bearish candle, a small-bodied candle (which can be bullish or bearish), and then a large bullish candle. This pattern suggests that the price is about to rise.
- Example: If you spot a Morning Star after a price drop, it might indicate that the market is ready to reverse direction and start climbing.
7. The Evening Star
This is the bearish counterpart to the Morning Star. It usually appears at the top of an uptrend and indicates that the price might start to fall. The pattern consists of a large bullish candle, a small-bodied candle, and a large bearish candle.
- Example: If a stock’s price has been rising and you see an Evening Star, it could mean that the price is about to reverse and head downward.
How to Use Candlestick Patterns in Trading
Candlestick patterns are not foolproof, but they are powerful tools when used correctly. Here are some tips for using them in your trading:
- Combine Patterns with Other Tools: Candlestick patterns are more reliable when used with other technical analysis tools like trendlines, support and resistance levels, and indicators like moving averages.
- Practice and Patience: It takes time to recognize and understand these patterns, so practice on historical charts or in a demo trading account before using them in live trading.
- Consider the Context: Always look at the overall market trend. A pattern that works well in a trending market might not be as effective in a choppy or sideways market.
- Use Stop-Loss Orders: To protect yourself from unexpected market moves, always use stop-loss orders when trading based on candlestick patterns. This helps limit potential losses if the market goes against your prediction.
Candlesticks are like the language of the market. By learning to read them, you can gain valuable insights into market behavior and make more informed trading decisions. Whether you’re a beginner or an experienced trader, understanding candlestick patterns is an essential skill that can help you navigate the financial markets with greater confidence.
Thank you for reading my article on candlestick patterns! If you’re eager to learn more, visit my Candlestick School page. It’s full of valuable information that will help you understand these patterns better and improve your trading skills.
JOIN WITH OUR CANDLESTICK SCHOOL! ITS FREE