
the Double Top Candlestick Pattern
The Double Top pattern is a powerful tool in trading, especially in the world of cryptocurrencies. It’s a sign that a price might be about to drop, and it helps traders make smart decisions. Let’s dive into what the Double Top pattern is, how to spot it, and how to use it in your trading strategy.
What is the Double Top Pattern?
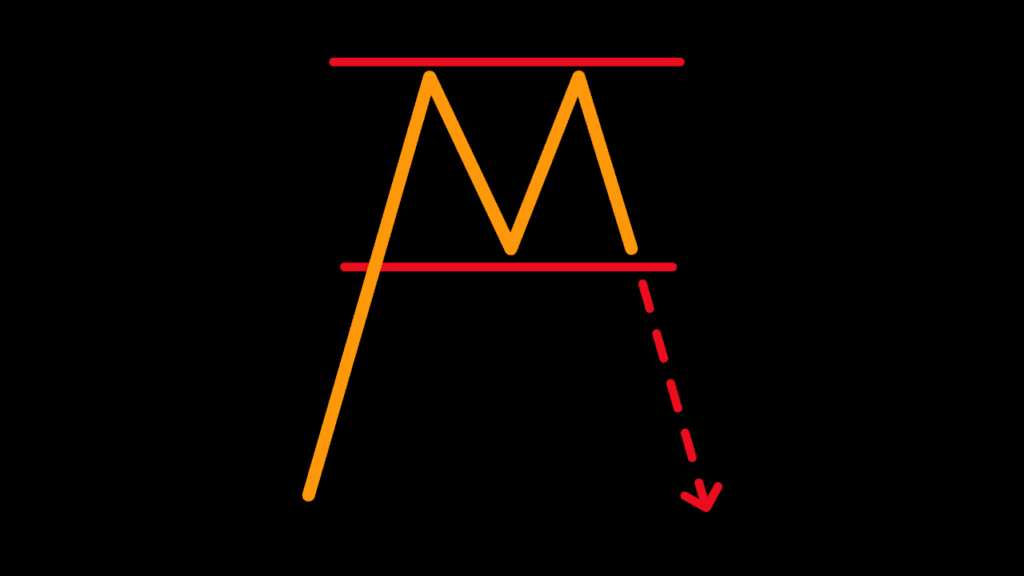
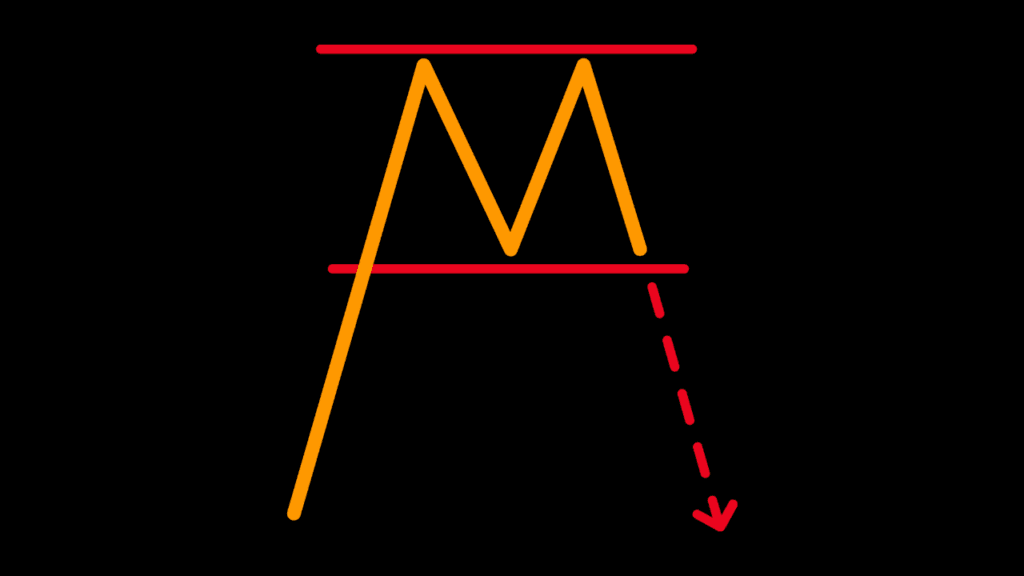
The Double Top pattern is a bearish reversal pattern, which means it indicates that an upward trend is about to end and a downward trend might start. It looks like the letter “M” on a price chart. Here’s how it forms:
- First Peak: The price rises to a high point and then falls back down.
- Valley: The price drops to a low point after the first peak.
- Second Peak: The price rises again to a level similar to the first peak, but then it falls back down again.
The key thing to note is that the price fails to break through the high point of the first peak. This failure shows that the upward momentum is weakening, and sellers are gaining control.
How to Spot a Double Top

To identify a Double Top pattern, look for these features on your candlestick chart:
- Two Peaks: The two high points (peaks) should be roughly at the same price level. This level is the resistance line.
- Valley: There should be a noticeable drop (valley) between the two peaks.
- Neckline: Draw a horizontal line through the lowest point of the valley. This line is called the neckline. When the price falls below this neckline after the second peak, it confirms the Double Top pattern.
Trading the Double Top
Once you spot a Double Top pattern, here’s how you can use it to make trading decisions:
- Entry Point: Enter a sell (short) trade when the price breaks below the neckline. This breakout confirms that the pattern is complete and the price is likely to move lower.
- Stop Loss: Place a stop loss above the second peak to protect yourself in case the price moves back up.
- Profit Target: Measure the distance from the neckline to the peaks. This distance is your target profit. Subtract this distance from the neckline to find your potential exit point.
Example of a Double Top Trade
Let’s say you see a Double Top pattern forming on a crypto chart. The peaks are at $50, and the valley between them is at $45. You draw the neckline at $45.
- When the price drops below $45, you enter a sell trade.
- You place your stop loss at $51 (just above the peaks).
- The distance between the peaks and the neckline is $5 ($50 – $45). You set your profit target at $40 ($45 – $5).
If the price falls to $40, you exit the trade with a profit.
Why the Double Top Pattern is Important
The Double Top pattern is important because it helps traders identify potential reversals. By recognizing this pattern, you can avoid getting caught in a downtrend after an uptrend and even profit from the price drop.
Tips for Using the Double Top Pattern
- Confirm with Volume: Look for higher trading volume during the price drop after the second peak. This increase in volume confirms that sellers are taking control.
- Use Other Indicators: Combine the Double Top pattern with other technical indicators like moving averages or RSI (Relative Strength Index) to increase your chances of success.
- Practice: Like any trading strategy, practice identifying and trading the Double Top pattern on demo accounts before using real money.
The Double Top pattern is a useful tool for predicting market reversals. By understanding how it forms and how to trade it, you can make smarter trading decisions. Remember to always use proper risk management and confirm the pattern with other indicators to improve your trading success. Happy trading!
Invitation to Our Candlestick School
Are you ready to dive into the fascinating world of candlestick patterns? Welcome to Candlestick School, your go-to page for everything you need to know about reading and interpreting candlestick charts!
What You’ll Learn
On this page, you’ll find detailed posts about various candlestick patterns. Whether you’re a beginner or an experienced trader, our guides will help you:
- Understand Basic Patterns: Learn the fundamentals of candlestick patterns and how they signal market movements.
- Master Advanced Patterns: Dive deeper into more complex patterns and refine your trading strategy.
- Get Practical Tips: Discover useful tips to enhance your trading skills and make smarter decisions.
Why Candlestick Patterns?
Candlestick patterns are powerful tools that can give you valuable insights into market trends. By learning to read these patterns, you can anticipate price movements and improve your trading success.
Join the Community
Become part of our trading community by exploring our posts, sharing your thoughts, and learning from fellow traders. We’re here to help you grow and succeed in your trading journey.
Explore our latest posts and start mastering candlestick patterns today! For more information and updates, visit our main website Hunnier or contact us at info@hunnier.com.
Happy Trading!
The Hunnier Team
Candlestick School Learn Everything About Candlestick Patterns


[…] the Double Top Candlestick Pattern […]
[…] the Double Top Candlestick Pattern […]