A double bottom candlestick pattern is a popular and powerful tool used by traders to predict the potential reversal of a downward trend in the price of an asset, like a stock or cryptocurrency. This pattern is typically viewed as a bullish reversal signal, meaning it suggests that after a downward trend, the market is likely to move upwards. This pattern is well-known for its simple appearance and reliability, making it a favorite among both new and experienced traders. In this article, we will cover in detail what the double bottom candlestick pattern is, the conditions under which it forms, how traders should react to it, and how to trade using it, along with practical examples, stop-loss levels, and take-profit targets.
What is a Double Bottom Candlestick Pattern?
A double bottom pattern looks like the letter “W” on a price chart, and it signals that the market may be reversing from a downtrend to an uptrend. The pattern forms when the price of an asset drops to a certain level (support level), bounces back, drops again to that same level, and then rises again. The two drops create two “bottoms,” which are the lowest points in the pattern, and the point between them is called the “neckline.”
The double bottom pattern suggests that sellers are losing strength. When the price falls for the first time and bounces back, it indicates that buyers are stepping in at that price level to prevent the price from falling further. When the price drops again to the same level and once again bounces back up, it confirms that this price level is strong support. Traders often view this as a signal that the price is ready to reverse and begin an upward movement.

Conditions When a Double Bottom Appears
To effectively use the double bottom pattern in trading, it’s important to recognize the specific conditions under which this pattern appears. The double bottom usually forms after a significant downward trend, meaning that the market has been experiencing a consistent drop in price. Traders should keep in mind that the double bottom is more reliable when it appears after a strong and prolonged downtrend, as it suggests the trend may be running out of steam.
There are a few key characteristics of a double bottom pattern:
- Two Bottoms: These are the two low points in the pattern, which are typically at the same price level. The first bottom occurs as the price is trending down, and the second bottom occurs after a brief upward movement (bounce).
- Neckline: This is the point between the two bottoms, which forms after the price bounces from the first bottom but before it drops to form the second bottom. The neckline acts as a resistance level, and the price must break above it for the pattern to be confirmed.
- Volume: The pattern is more reliable when the trading volume increases as the price breaks above the neckline. This suggests that more traders are getting involved, adding strength to the upward movement.
How to React to a Double Bottom
When you spot a double bottom pattern forming on a price chart, it’s important not to rush into a trade too early. Many inexperienced traders make the mistake of entering a buy trade as soon as they see the second bottom forming, but this can be risky because the price may continue to fall. Instead, traders should wait for confirmation that the double bottom is valid and that the price is likely to rise.
Here are some key steps to take when reacting to a double bottom pattern:
- Wait for Confirmation: The most important rule when trading the double bottom pattern is to wait for the price to break above the neckline before entering a trade. This confirms that the market has completed the pattern and is likely to move upwards.
- Check the Volume: Look at the trading volume when the price breaks the neckline. A significant increase in volume is a strong sign that the upward movement will continue. If the volume is low, it may be a false breakout, and the price could fall back below the neckline.
- Set Entry Points: Once the price breaks above the neckline with strong volume, it’s usually a good time to enter a buy trade.
Example: How to Trade a Double Bottom
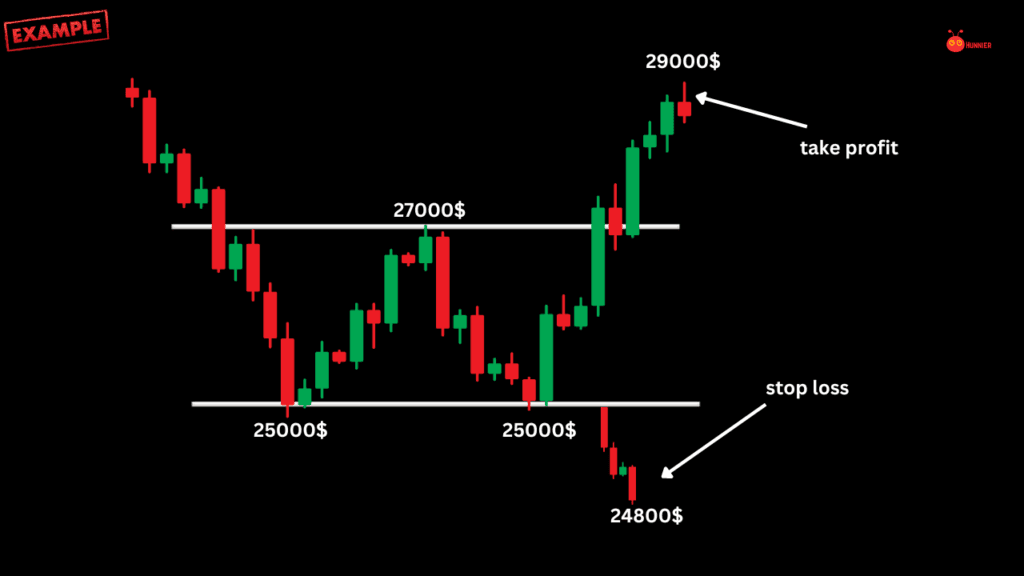
Let’s consider an example to understand how to trade a double bottom pattern. Imagine the price of Bitcoin has been in a downtrend and recently dropped to $25,000, bounced to $27,000 (neckline), and then fell again to $25,000. After reaching this level a second time, the price starts to rise, and eventually breaks above the neckline at $27,000.
In this case, the trader would wait for the price to close above $27,000 before entering a buy trade. The stop-loss order should be placed below the second bottom at $24,800 to protect against any further price drops. To determine the take-profit level, measure the distance between the neckline and the bottoms. In this example, the distance is $2,000 ($27,000 – $25,000). You can then add this distance to the neckline to set a take-profit target at $29,000.
Here’s a summary of the trade:
- Entry: Buy when the price breaks and closes above $27,000.
- Stop Loss: Place the stop-loss order below the second bottom at $24,800.
- Take Profit: Set a take-profit target at $29,000.
Stop-Loss and Take-Profit Targets
When trading the double bottom pattern, it’s crucial to set appropriate stop-loss and take-profit targets to manage risk and maximize potential profits. Stop-loss orders help limit your losses if the trade moves against you, while take-profit targets allow you to lock in profits when the price reaches a certain level.
Stop-Loss Placement: The best place to set your stop-loss order is below the second bottom of the pattern. This level acts as strong support, and if the price falls below it, the double bottom pattern is invalidated, meaning the upward movement is unlikely to continue. Placing the stop-loss order just below this level helps minimize risk while giving the trade enough room to breathe.
Take-Profit Target: To calculate the take-profit target, measure the distance between the lowest point of the double bottom and the neckline. Add this same distance to the neckline to determine the likely upside potential. This method gives you a clear price target and helps ensure you don’t exit the trade too early.
Example of Stop-Loss and Take-Profit Targets
Let’s return to our earlier example where Bitcoin formed a double bottom at $25,000, with the neckline at $27,000. The distance between the bottom and the neckline is $2,000. To calculate the take-profit target, add $2,000 to the neckline, which gives you a target of $29,000. The stop-loss order should be placed below the second bottom, such as at $24,800, to protect against further downside.
In this case:
- Entry: Buy when the price breaks above $27,000.
- Stop Loss: Set a stop-loss order below the second bottom at $24,800.
- Take Profit: Set the take-profit target at $29,000.
The double bottom candlestick pattern is a reliable and straightforward tool for identifying potential reversals in downtrending markets. By waiting for the price to break above the neckline and confirming the pattern with strong volume, traders can enter trades with confidence that the price is likely to move higher. Properly setting stop-loss and take-profit targets is also crucial for managing risk and maximizing gains.
This pattern is especially useful for beginners because it’s easy to spot on price charts and offers clear entry and exit points. To learn more about technical analysis and other candlestick patterns, you can explore additional resources online “click “. Understanding these patterns is essential for anyone who wants to trade confidently and effectively in the cryptocurrency or stock market.
Thank you for taking the time to read through our Candlestick School page! We hope the information provided has helped you better understand candlestick patterns and how to apply them in your trading journey. At Hunnier, we’re committed to making learning about cryptocurrency simple and accessible for everyone. If you have any questions or want to dive deeper, feel free to explore more content on our site. Happy trading!









🌐 thank you for sharing knowledge free