The Ascending Triangle candlestick pattern is one of the most useful and simple patterns that traders use to predict the direction of the market. It signals that the price of an asset, whether it’s a cryptocurrency, stock, or any other financial instrument, might continue to rise. This pattern is very popular in technical analysis because it’s easy to spot and provides clear signals for entering a trade. In this article, we’ll explore the Ascending Triangle pattern in detail, when it forms, what it means, and how you can use it to your advantage in trading.
What Is the Ascending Triangle Pattern?
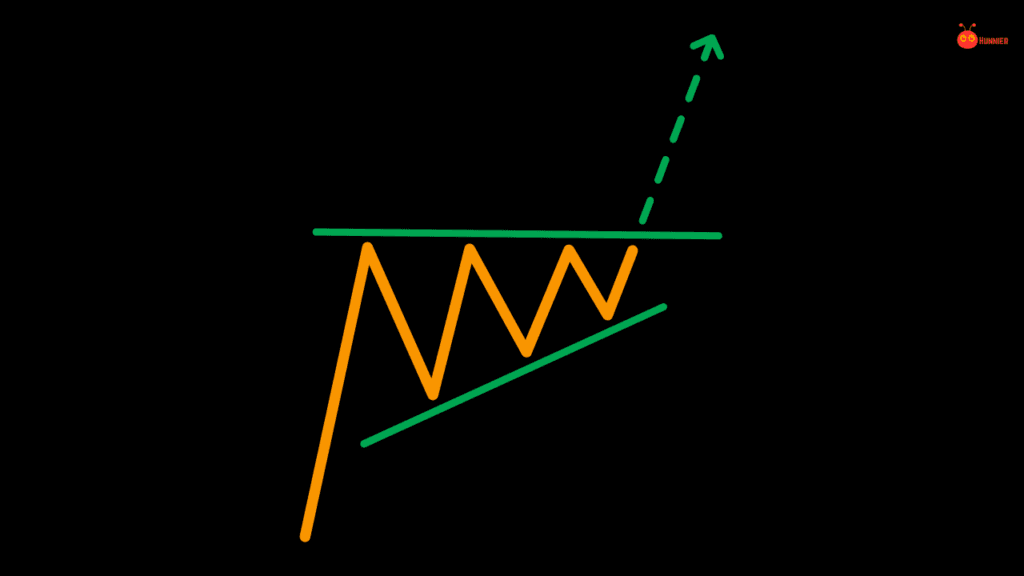
The Ascending Triangle is a bullish continuation pattern, meaning it suggests that the market will continue moving in the same upward direction after the pattern completes. The pattern forms when there’s a flat or nearly flat resistance line at the top, and a rising support line at the bottom. Essentially, the price keeps hitting the resistance level but doesn’t break it, while the lows keep getting higher, forming an upward-sloping line.
Imagine you’re looking at a price chart, and you notice that each time the price pulls back, it doesn’t fall as far as the previous pullback. This creates higher lows, which is a sign that buyers are becoming more aggressive and pushing the price up. Meanwhile, the price keeps hitting the same high point, showing that there’s a strong level of resistance that the price hasn’t broken yet.
Eventually, the pressure builds up, and when the price breaks through the resistance level, it typically leads to a strong upward movement. That’s when traders often jump in to buy because it signals that the market is likely to continue in an upward direction.

When Does the Ascending Triangle Pattern Happen?
The Ascending Triangle pattern usually forms during an uptrend. This is when the price has been rising for some time, and traders are expecting it to keep going higher. The pattern shows up when the market takes a breather, and the buyers and sellers start to battle it out. Sellers are trying to hold the price down at a certain level (the resistance), but buyers are pushing the price up each time it falls, creating those higher lows.
While the Ascending Triangle is most commonly seen in uptrends, it can also appear in other market conditions, like during a period of sideways movement. In such cases, it indicates that the market is gathering strength, and a breakout to the upside is more likely.
One important thing to note is that the Ascending Triangle takes time to develop. The pattern doesn’t happen in a day or two—it usually forms over several weeks or even months. The longer the pattern takes to develop, the stronger the breakout is likely to be when it finally happens.
What Should You Do When the Ascending Triangle Happens?
When you spot an Ascending Triangle, the first thing to do is to wait for confirmation. This means waiting for the price to break through the resistance level at the top of the triangle. Until that happens, the pattern isn’t complete, and the market could go either way. Patience is key.
Once the price breaks above the resistance level and closes above it, this is your signal to enter a buy trade. But don’t just jump in blindly—there are a few steps to follow to make sure you’re trading smart.
- Wait for a Retest (Optional): After the price breaks through the resistance, it might come back down and test that level again. This is known as a retest. If the price holds above the resistance (which is now acting as support), it’s a strong signal that the breakout is real, and you can enter a trade. Some traders prefer to wait for the retest before buying because it gives them extra confirmation that the price is going to continue upwards.
- Set a Stop Loss: Even though the Ascending Triangle is a bullish pattern, there’s always a chance the trade could go against you. To protect yourself, set a stop-loss order just below the last low of the triangle. This way, if the market suddenly turns around, your losses will be limited.
- Set a Take-Profit Target: To set a take-profit target, measure the height of the triangle (the distance between the support and resistance levels) and add that to the breakout point. This gives you an idea of how far the price might go once it breaks out. For example, if the height of the triangle is $100, and the price breaks out at $500, your take-profit target would be $600.
- Watch the Volume: Volume plays a key role in confirming the breakout. A breakout with high volume means that more traders are participating, and the price is more likely to continue rising. If the breakout happens on low volume, it might be a false breakout, meaning the price could fall back into the triangle.
Example of Trading with the Ascending Triangle Pattern
Let’s look at a simple example to understand how to trade with an Ascending Triangle pattern.
Imagine you’re looking at a chart of Ethereum, and the price has been in an uptrend. You notice that the price keeps hitting a resistance level at $3,000 but isn’t able to break through it. Meanwhile, each time the price pulls back, it only drops to higher lows, forming a rising support line.
Now, you have the perfect setup for an Ascending Triangle pattern. The price eventually breaks above the $3,000 resistance level with strong volume, signaling that the market is likely to continue moving upwards.
what you would do next ?
- Enter a Buy Trade: As soon as the price breaks above $3,000 and closes above it, you would enter a buy trade.
- Set a Stop Loss: Place your stop loss just below the last low of the triangle. In this case, that might be around $2,900.
- Set a Take-Profit Target: To set your take-profit target, measure the height of the triangle. If the height is $200, your take-profit target would be $3,200 ($3,000 + $200).
How to Spot the Ascending Triangle Pattern
Spotting an Ascending Triangle is fairly straightforward, but it takes practice. Here are some tips to help you identify the pattern:
- Look for Higher Lows: The first sign of an Ascending Triangle is the rising support line, which is created by the higher lows. This shows that buyers are stepping in at higher price levels each time the price dips.
- Check for a Flat Resistance Level: The second key feature of the pattern is the flat resistance line at the top. This shows that sellers are holding the price down at a certain level, but they’re losing control as buyers keep pushing the price up.
- Wait for the Breakout: The most important part of the pattern is the breakout. The pattern isn’t complete until the price breaks through the resistance level and closes above it. If the price breaks below the rising support line instead, the pattern is invalidated, and you should avoid entering a trade.

The Psychology Behind the Ascending Triangle
The Ascending Triangle pattern reflects the psychology of the market. The flat resistance level shows that sellers are trying to hold the price down at a certain level, but the rising support line shows that buyers are getting stronger. Each time the price dips, buyers are willing to pay a higher price, which pushes the price up.
Eventually, the buyers become strong enough to break through the resistance level, causing a breakout. This shift in market sentiment is what makes the Ascending Triangle such a reliable pattern for predicting upward movements in price.
The Ascending Triangle pattern is a simple yet powerful tool for traders. It’s easy to spot, provides clear signals, and helps traders make informed decisions about when to enter and exit trades. The key to success with this pattern is patience—waiting for the breakout and confirming it with volume before entering a trade is essential.
If you’re new to trading or want to improve your technical analysis skills, the Ascending Triangle is a great pattern to start with. It helps you understand the market’s behavior and gives you a reliable way to trade in the direction of the trend.
For more detailed insights and strategies on trading patterns, you can check out additional resources and guides online ;
If you’re looking to dive deeper into the Ascending Triangle candlestick pattern or want more sources to expand your knowledge, here are some helpful links that provide additional insights and detailed explanations. These resources can guide you in better understanding the pattern and how to trade it effectively:
- Investopedia – Ascending Triangle Pattern Explanation:
- Babypips – Chart Patterns Guide:
- TradingView – Ascending Triangle Pattern Analysis:
- The Balance – Introduction to Chart Patterns:
- StockCharts – Technical Analysis of Chart Patterns:
These resources will help you gain more clarity and refine your strategy when using the Ascending Triangle in trading.
Thank you for taking the time to read our article on the Ascending Triangle candlestick pattern! We hope it provided valuable insights and helped you understand how to spot and trade this powerful pattern. For beginner traders, remember to always start small, be patient, and never rush into trades without proper analysis. The key to success in trading is continuous learning and practice.
If you’re just starting out, feel free to explore more educational resources on our site at Hunnier.com. We offer a wide range of simple and informative guides to help you on your trading journey, including our Candlestick School for mastering candlestick patterns.
Good luck with your trading, and remember—success comes with time and knowledge! Happy trading!