
The Ascending Triangle Candlestick Pattern
The Ascending Triangle is a powerful chart pattern that traders love to spot because it often signals a strong upward move in the market. Imagine it as a rising staircase with a ceiling—each step brings you closer to breaking through to the next level. This pattern tells a story of a market that’s building up pressure and is ready to make a significant move.
What Does an Ascending Triangle Look Like?
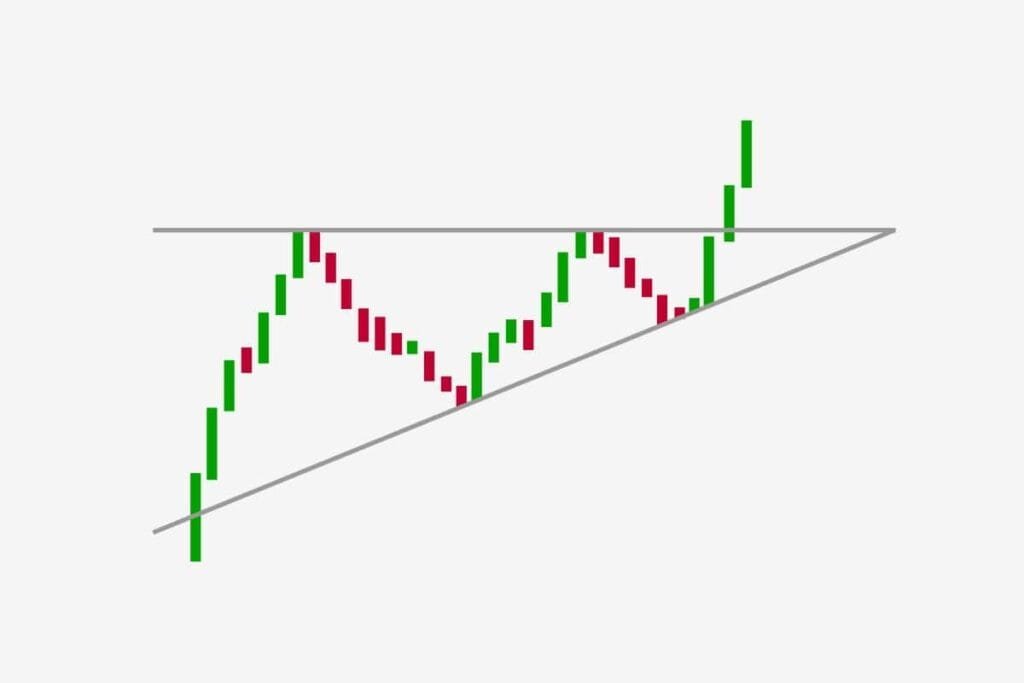
An Ascending Triangle forms when the price of a cryptocurrency moves in a way that creates two key lines on a chart:
- Flat Top Line (Resistance): This is the horizontal line at the top of the pattern. It connects the points where the price reaches its peak but fails to go higher. Think of it as the ceiling that the price keeps bumping into.
- Rising Bottom Line (Support): This is the upward-sloping line at the bottom of the pattern. It connects the points where the price hits a low but each time it does, the low is higher than the previous one. This line shows that buyers are getting stronger, pushing the price higher each time it dips.
As these two lines converge, they form a triangle shape. The flat top line shows that sellers are holding the price down at a certain level, while the rising bottom line shows that buyers are getting more aggressive, refusing to let the price drop as much as before.
How to Spot an Ascending Triangle
Finding an Ascending Triangle on a price chart is like discovering a hidden treasure. Here’s how to spot it:
- Look for a Flat Top: The first thing to notice is a flat top line, where the price keeps reaching a similar high but doesn’t go above it. This shows that there’s resistance at that level—sellers are stepping in and preventing the price from climbing higher.
- Identify the Rising Bottom Line: Next, look for the rising bottom line. This line connects the lows in the price, showing that each time the price dips, it doesn’t fall as far as before. Buyers are stepping in sooner and pushing the price back up.
- Watch for Volume: An important clue when spotting an Ascending Triangle is to look at the trading volume. Usually, the volume decreases as the pattern forms, showing that the market is waiting for a breakout. When the breakout happens, you often see a surge in volume, confirming the move.
- Breakout: The most exciting part of the Ascending Triangle is the breakout. When the price finally breaks through the flat top line (resistance), it usually leads to a strong upward move. This is when the buyers overwhelm the sellers, pushing the price higher. Traders often look for this breakout to make their move, entering the market just as the price starts to soar.
Why Is the Ascending Triangle Important?
The Ascending Triangle is important because it gives traders a clear signal that the market is likely to go up. The pattern shows that while sellers are keeping the price in check at a certain level, buyers are becoming more confident and are willing to pay higher prices each time the market dips. When this pressure builds up, it often results in a breakout to the upside, making it a great opportunity for traders to enter the market.
In summary, the Ascending Triangle is a reliable and exciting pattern that signals a potential strong upward move in the market. By learning to spot this pattern, you can gain an edge in your trading, knowing when the market is likely to break out and make your next move.
FAQ: Understanding the Ascending Triangle
1. What is an Ascending Triangle?
- An Ascending Triangle is a chart pattern that signals a potential upward breakout in the market. It forms when the price creates a flat top line (resistance) and a rising bottom line (support), converging into a triangle shape.
2. How do I spot an Ascending Triangle?
- Look for a flat top line where the price hits the same high repeatedly, and a rising bottom line where the price creates higher lows. These lines should converge, forming a triangle. Pay attention to decreasing volume during the pattern formation and a surge in volume during the breakout.
3. Why is the Ascending Triangle important for traders?
- The Ascending Triangle is important because it often predicts a strong upward move in the market. It shows that buyers are becoming more confident and are pushing the price higher, while sellers are holding the price down at a certain level. When the price breaks through the resistance, it usually leads to a significant price increase.
4. What does a breakout mean in an Ascending Triangle?
- A breakout occurs when the price finally moves above the flat top line (resistance) of the triangle. This is usually accompanied by a surge in trading volume, confirming the move. The breakout indicates that buyers have overpowered sellers, and the price is likely to continue rising.
5. Can an Ascending Triangle form in any market?
- Yes, an Ascending Triangle can form in any market, including stocks, commodities, forex, and cryptocurrencies. It is a universal pattern that traders look for across different assets.
6. How reliable is the Ascending Triangle pattern?
- The Ascending Triangle is generally considered a reliable pattern, especially when it forms over a longer time frame and is accompanied by confirming signals, such as increased volume during the breakout. However, like all patterns, it’s not foolproof, and traders should use other indicators and risk management strategies in conjunction with it.
7. What should I do when I spot an Ascending Triangle?
- When you spot an Ascending Triangle, keep an eye on the price action near the resistance line. If the price breaks above this line with strong volume, it could be a good opportunity to enter a long position. Always consider your risk tolerance and use stop-loss orders to protect your trades.
8. What happens if the price doesn’t break out?
- If the price doesn’t break out and instead falls below the rising bottom line, the pattern is invalidated. This could signal a potential reversal or continuation of the previous trend. In such cases, it’s important to reassess your trading strategy and consider exiting the position.
This FAQ provides a quick overview of the Ascending Triangle and how to use it effectively in trading. Understanding this pattern can help you make more informed decisions in the market.
learn more