Head and Shoulders Candlestick Pattern
The Head and Shoulders pattern is one of the most reliable and well-known patterns in technical analysis. It helps traders identify potential trend reversals in the market. This pattern is formed by three peaks: two smaller ones (the shoulders) and a taller one in the middle (the head). Let’s break it down step by step.
What is the Head and Shoulders Pattern?
The Head and Shoulders pattern is a chart formation that predicts a reversal in the current trend. It has two types:
Head and Shoulders Top: This pattern forms after an uptrend and signals that the trend is about to reverse downwards.
Inverse Head and Shoulders: This pattern forms after a downtrend and signals that the trend is about to reverse upwards.

In this article, we will focus on the Head and Shoulders Top pattern.
Components of the Head and Shoulders Pattern
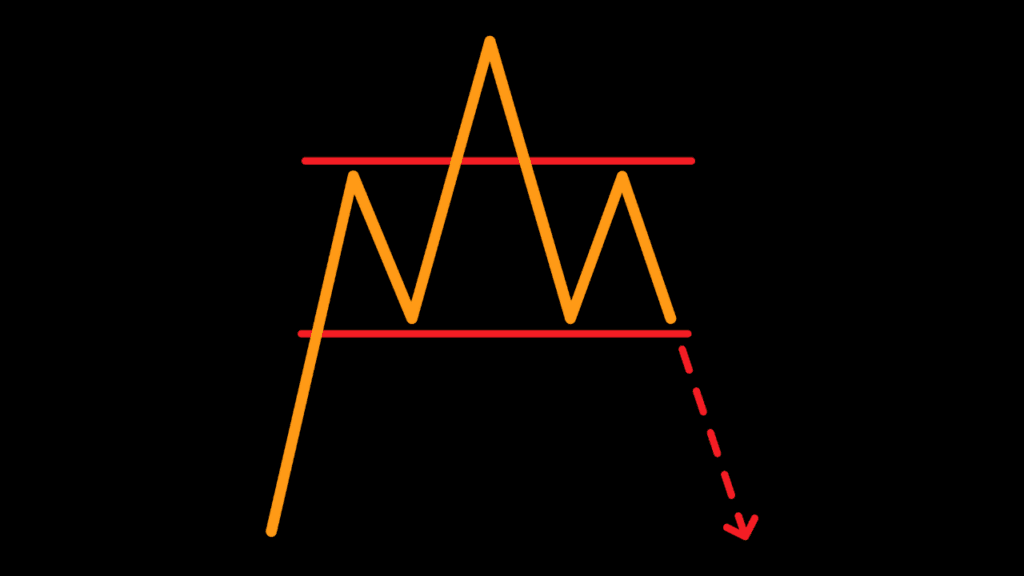
- Left Shoulder: The price rises to a peak and then declines, forming the first shoulder.
- Head: The price rises again, this time to a higher peak, and then declines.
- Right Shoulder: The price rises once more, but not as high as the head, and then declines again.
- Neckline: This is a support level drawn by connecting the low points of the left shoulder and the head. It acts as a key level for confirming the pattern.
How to Identify the Head and Shoulders Pattern
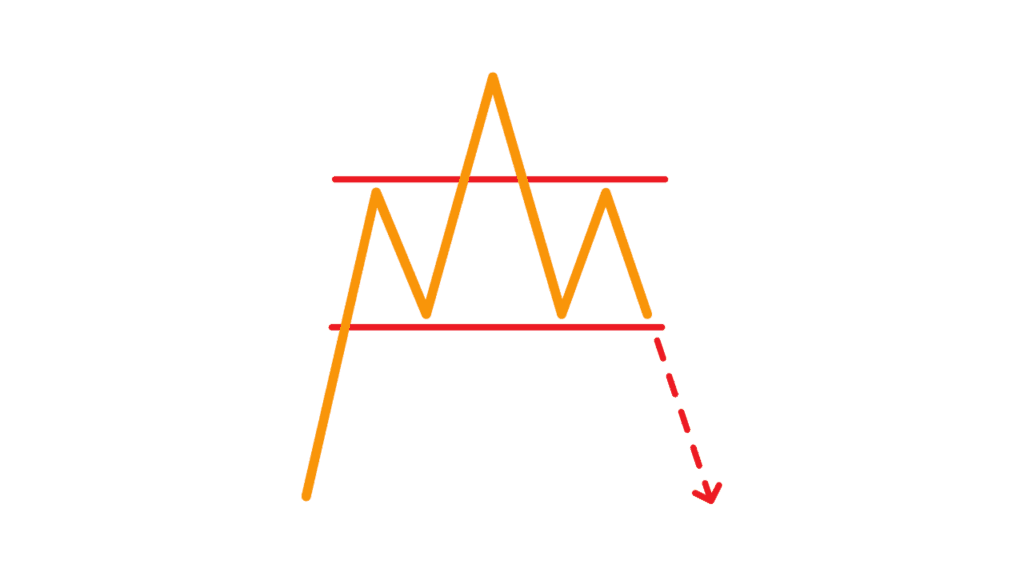
- Look for Three Peaks: The pattern starts with a peak (left shoulder), followed by a higher peak (head), and then a lower peak (right shoulder).
- Draw the Neckline: Connect the low points between the shoulders and the head to form the neckline. This line helps confirm the pattern.
- Volume Analysis: Volume often decreases with each peak, showing weakening momentum.
How to Trade the Head and Shoulders Pattern
- Wait for Confirmation: The pattern is confirmed when the price breaks below the neckline after forming the right shoulder. This signals the start of a downtrend.
- Enter a Trade: Once the price breaks the neckline, you can enter a short position (betting the price will go down).
- Set a Target Price: Measure the distance from the top of the head to the neckline. Subtract this distance from the breakout point to set your target price.
- Place a Stop Loss: To protect against unexpected moves, place a stop loss above the right shoulder.
Example of the Head and Shoulders Pattern
Imagine a stock that has been rising for several months. It forms a peak at $100 (left shoulder), then rises to $120 (head), and finally forms another peak at $110 (right shoulder). The lows between these peaks are at $90 and $95, respectively. Drawing a line through these lows forms the neckline.
If the stock price falls below the neckline at $95 after forming the right shoulder, it confirms the pattern. A trader could then short the stock, aiming for a target price of around $70 (the height from the head to the neckline subtracted from the neckline).
Why the Head and Shoulders Pattern is Important
- Predictive Power: The Head and Shoulders pattern is highly regarded for its ability to predict trend reversals. Recognizing this pattern can give traders an early signal to enter or exit trades.
- Widely Recognized: Many traders use this pattern, making it a self-fulfilling prophecy. When enough traders act on it, it often drives the market in the predicted direction.
- Simple to Identify: With practice, spotting the Head and Shoulders pattern becomes easier, making it accessible for traders at all levels.
The Head and Shoulders pattern is a powerful tool in technical analysis that helps traders spot potential reversals. By understanding its components and knowing how to trade it, you can improve your trading strategy and make more informed decisions. Remember to always use other indicators and analysis methods to confirm your findings and manage risks effectively. Happy trading!
Welcome to Candlestick School
Are you ready to dive into the fascinating world of candlestick patterns? Welcome to Candlestick School, your go-to page for everything you need to know about reading and interpreting candlestick charts!
What You’ll Learn
On this page, you’ll find detailed posts about various candlestick patterns. Whether you’re a beginner or an experienced trader, our guides will help you:
- Understand Basic Patterns: Learn the fundamentals of candlestick patterns and how they signal market movements.
- Master Advanced Patterns: Dive deeper into more complex patterns and refine your trading strategy.
- Get Practical Tips: Discover useful tips to enhance your trading skills and make smarter decisions.
Why Candlestick Patterns?
Candlestick patterns are powerful tools that can give you valuable insights into market trends. By learning to read these patterns, you can anticipate price movements and improve your trading success.
Join the Community
Become part of our trading community by exploring our posts, sharing your thoughts, and learning from fellow traders. We’re here to help you grow and succeed in your trading journey.
Explore our latest posts and start mastering candlestick patterns today! For more information and updates, visit our main website Hunnier or contact us at info@hunnier.com.
Happy Trading!
The Hunnier Team