Bearish Butterfly Pattern
The bearish butterfly pattern is a harmonic chart pattern that helps traders identify potential reversal points, signaling that a price downturn might follow an uptrend. Used in technical analysis, this pattern allows traders to spot ideal entry and exit points. With its unique combination of Fibonacci ratios, the bearish butterfly can be a powerful tool for forecasting market changes. This article will guide you through the pattern’s structure, its Fibonacci relationships, and how traders interpret and apply it.
Structure of the Bearish Butterfly Pattern
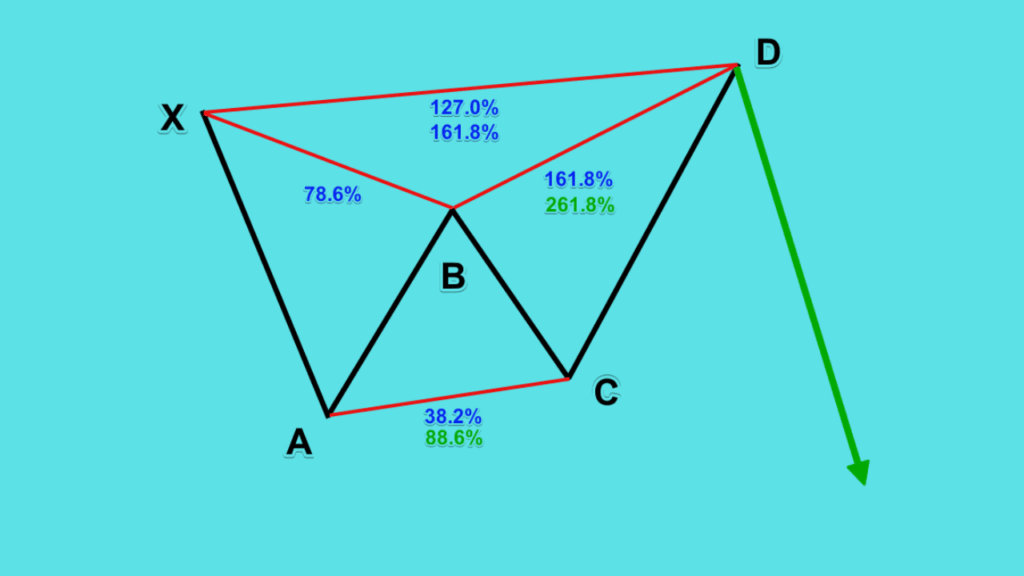
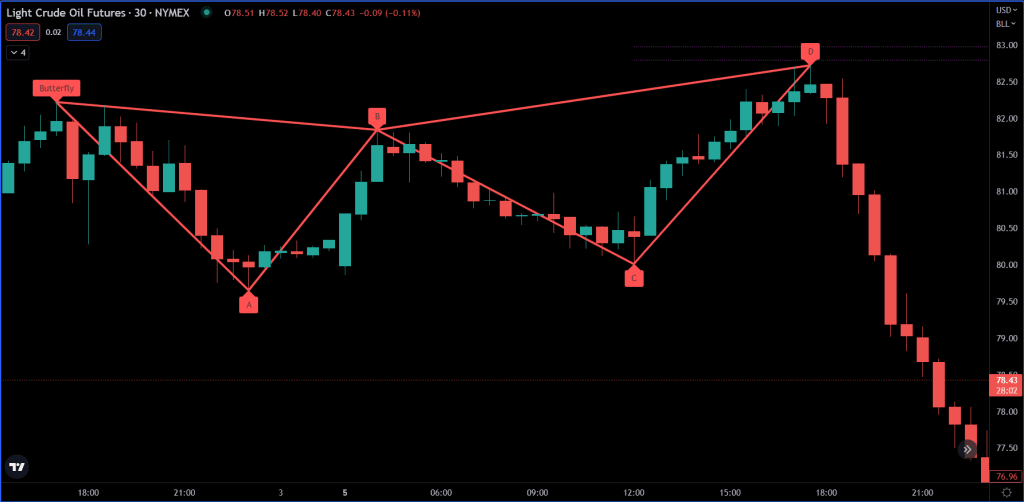
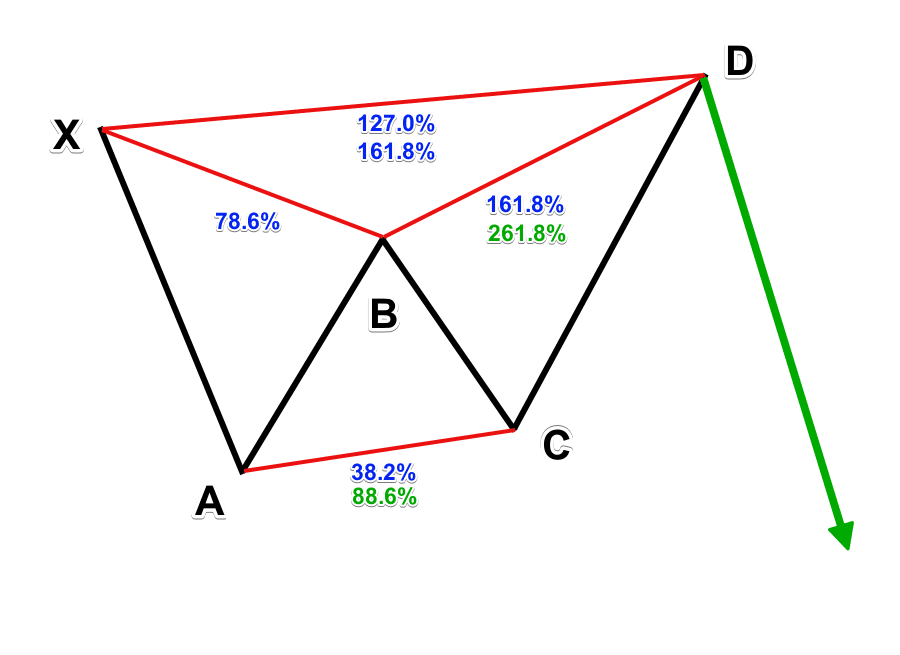
The bearish butterfly pattern consists of four main price swings or legs: X-A, A-B, B-C, and C-D. Each leg adheres to specific Fibonacci retracement and extension levels, providing traders with reliable guidelines to validate the pattern.
- X-A Leg: The pattern begins with the X-A leg, an initial price move upwards. This leg establishes the primary trend before retracement.
- A-B Leg: Next is the A-B leg, a retracement that typically measures around 78.6% of the X-A leg. This pullback signals the beginning of a potential reversal but doesn’t yet confirm it.
- B-C Leg: Following the A-B retracement, the B-C leg forms, which may retrace between 38.2% and 88.6% of the A-B leg. This leg is often shorter than X-A and can vary based on market volatility.
- C-D Leg: The final C-D leg is the extension of the X-A leg, reaching around 127.2% or 161.8%. This leg is essential, as reaching these levels indicates a possible completion of the pattern, signaling that a reversal may be near.
Key Fibonacci Levels in the Bearish Butterfly Pattern
The bearish butterfly pattern is heavily based on Fibonacci ratios—mathematical relationships found throughout nature and widely used in trading. These ratios allow traders to forecast market movements and understand the natural rhythm of price fluctuations.
- 78.6% Retracement for A-B: The A-B leg often retraces 78.6% of the X-A leg, a significant level that helps validate the pattern’s structure. This level indicates that a deeper retracement might be underway.
- 38.2%-88.6% Retracement for B-C: The B-C leg, often shorter than A-B, may retrace between 38.2% and 88.6% of A-B. This level provides flexibility within the pattern, accounting for varied market conditions.
- 127.2%-161.8% Extension for C-D: The C-D leg is the longest extension and completes the pattern. When price reaches 127.2% or 161.8% of the X-A leg, it signals the completion of the pattern, alerting traders to a possible reversal zone.
Interpreting the Bearish Butterfly Pattern
The bearish butterfly pattern is typically seen as a signal for a bearish reversal once the pattern completes at point D. This completion, at a Fibonacci extension level of 127.2% or 161.8% of X-A, serves as a warning that the upward trend may soon reverse.
Traders typically open a short position when the price reaches the D point, anticipating a downward move. This short position aims to capitalize on the upcoming downtrend while minimizing risk. Many traders also use this point to set stop-loss levels above the D point, as this reduces the potential loss if the reversal does not occur.
Managing Risk with Stop-Loss and Take-Profit Levels
Risk management is essential when trading with the bearish butterfly pattern. After identifying point D as a likely reversal zone, traders often place a stop-loss slightly above this point. This allows them to limit losses if the pattern fails and the price continues upward.
For take-profit levels, traders often target the B or C points in the pattern, where retracements may occur. These levels allow traders to exit the position while still making a profit on the reversal. This strategy keeps risk manageable and lets traders maximize gains without exposing their position to excessive downside risk.
Limitations of the Bearish Butterfly Pattern
Like all trading patterns, the bearish butterfly is not foolproof. It relies heavily on Fibonacci ratios, and there’s no guarantee that price movements will adhere to these levels. External factors like market news, economic events, or shifts in investor sentiment can disrupt the pattern’s predictive ability.
Additionally, the bearish butterfly can be challenging for beginner traders to identify accurately. Recognizing the pattern’s structure, especially in volatile markets, requires practice. Misidentifying the pattern can lead to poor entry and exit points, resulting in unnecessary losses.
Using the Bearish Butterfly Pattern with Other Indicators
To increase the bearish butterfly pattern’s effectiveness, many traders combine it with other indicators. Relative Strength Index (RSI) and Moving Average Convergence Divergence (MACD) are popular choices. RSI can help identify overbought conditions, while MACD can confirm bearish momentum, making these indicators particularly useful for validating a bearish reversal.
For instance, if RSI shows an overbought signal as the price nears point D, it strengthens the case for a reversal. Similarly, if MACD indicates weakening momentum, traders gain additional confirmation that a downtrend might follow.
The bearish butterfly pattern is a valuable tool for identifying potential bearish reversals, offering traders insight into market trends through precise Fibonacci ratios. While powerful, it also has limitations and requires skill to apply accurately. Combining the bearish butterfly with other indicators and using stop-loss levels can increase a trader’s chance of success and manage risk effectively.
External Resources
For more details on harmonic patterns, Fibonacci ratios, and trading strategies, refer to the following resources:
- Investopedia: Harmonic Patterns
- Fibonacci Retracement Explained
- Using RSI and MACD with Chart Patterns
- Fibonacci Ratios and Market Trading
These links provide further insights into harmonic trading and the broader technical analysis techniques that can be used alongside the bearish butterfly pattern for successful trading.
If you found this guide on the Bearish Butterfly Pattern insightful, explore more of our resources. To deepen your knowledge of trading patterns, visit our Candlestick School page on Hunnier. There, you’ll find comprehensive lessons on candlestick patterns, essential for mastering technical analysis and elevating your trading skills. Explore more and enhance your trading strategy today!

